Part A and B: Under (Blood) Pressure
Hypothesis: If a person exercises or makes changes in the body position, then there will be corresponding changes in their pulse rate and blood pressure and an individual's "fitness index" can be determined.
Materials:
-stool (chair)
-stethoscope
-sphygmomanometer
-timer
Procedures:
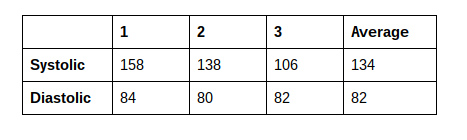
1. Choose a group member to do the experiment on and find his systolic and diastolic pressure (note: you will be using the same person throughout the whole experiment)
2. Put the sphygmomanometer on the subject's arm and inflate up to 200 mm Hg
3. Put stethoscope on arm just under sphygmomanometer cuff
4. Slowly decrease pressure and record the mm Hg when the first sound is heard (this is systolic)
5. Continue decreasing pressure until the sound disappears (this is diastolic)
6. Record data
Next you will be recording the change in blood pressure from lying down to standing up
1. Have subject lie down for 5 minutes, after 5 minute equilibration period measure systolic and diastolic in mm Hg. Measure twice and find the average between the two data points and record the average. (in order to find change in pressure, subtract diastolic from systolic)
2. Have subject stand for 3 minutes. After 3 minute equilibration period measure systolic and diastolic in mm Hg. Measure twice and find the average between the two data points and record the average.
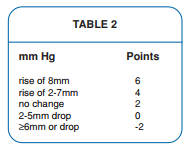
3. Assign fitness points based on the values in Table 2
Hypothesis: If a person exercises or makes changes in the body position, then there will be corresponding changes in their pulse rate and blood pressure and an individual's "fitness index" can be determined.
Materials:
-stool (chair)
-stethoscope
-sphygmomanometer
-timer
Procedures:
1. Choose a group member to do the experiment on and find his systolic and diastolic pressure (note: you will be using the same person throughout the whole experiment)
2. Put the sphygmomanometer on the subject's arm and inflate up to 200 mm Hg
3. Put stethoscope on arm just under sphygmomanometer cuff
4. Slowly decrease pressure and record the mm Hg when the first sound is heard (this is systolic)
5. Continue decreasing pressure until the sound disappears (this is diastolic)
6. Record data
Next you will be recording the change in blood pressure from lying down to standing up
1. Have subject lie down for 5 minutes, after 5 minute equilibration period measure systolic and diastolic in mm Hg. Measure twice and find the average between the two data points and record the average. (in order to find change in pressure, subtract diastolic from systolic)
2. Have subject stand for 3 minutes. After 3 minute equilibration period measure systolic and diastolic in mm Hg. Measure twice and find the average between the two data points and record the average.
3. Assign fitness points based on the values in Table 2
Next you will be recording the Standing Pulse Rate
1. Have subject stand motionless for 2 minutes. After 2 minutes have passed, have the measurer determine the pulse rate by placing the first finger on the person's wrist above the thumb. Do not use your own thumb since it has a pulse of its own. Count the beats for 30 seconds and multiply by 2 to get rate per minute. Repeat a second time and find the average.
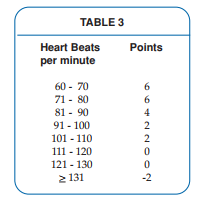
2. Assign fitness points based on the data using Table 3.
1. Have subject stand motionless for 2 minutes. After 2 minutes have passed, have the measurer determine the pulse rate by placing the first finger on the person's wrist above the thumb. Do not use your own thumb since it has a pulse of its own. Count the beats for 30 seconds and multiply by 2 to get rate per minute. Repeat a second time and find the average.
2. Assign fitness points based on the data using Table 3.
Next you will be recording the Reclining Pulse Rate
1. Have subject lie down for 5 minutes. After time elapses record pulse rate twice and record average. (keep subject lying down for next part)
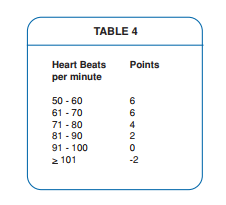
2. Assign fitness points based on data using Table 4.
1. Have subject lie down for 5 minutes. After time elapses record pulse rate twice and record average. (keep subject lying down for next part)
2. Assign fitness points based on data using Table 4.
Next you will be recording the Reclining to Standing Pulse Rate
1. Have subject (still lying down) quickly stand up and immediately record pulse rate.
2. Subtract this value from the Reclining Pulse Rate and record the reclining to standing difference.
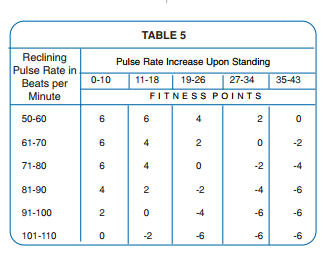
3. Assign a score based on the reclining to standing difference using table 5.
1. Have subject (still lying down) quickly stand up and immediately record pulse rate.
2. Subtract this value from the Reclining Pulse Rate and record the reclining to standing difference.
3. Assign a score based on the reclining to standing difference using table 5.
Next will be the Step Test for Endurance:
1. Using a step stool have a subject step up and step down and repeat this exercise 4 times with 3 seconds between each repeat.
2. Once last repeat is completed immediately start recording heart rate. Record every 15 seconds restarting the count every 15 seconds until heart rate returns to standing rate (or until 150 seconds passed). Multiply the count acquired every 15 seconds by 4 in order to find heart rate.
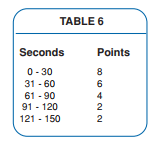
3. Assign a score based on the amount of time needed for body to return to standing rate using table 6.
1. Using a step stool have a subject step up and step down and repeat this exercise 4 times with 3 seconds between each repeat.
2. Once last repeat is completed immediately start recording heart rate. Record every 15 seconds restarting the count every 15 seconds until heart rate returns to standing rate (or until 150 seconds passed). Multiply the count acquired every 15 seconds by 4 in order to find heart rate.
3. Assign a score based on the amount of time needed for body to return to standing rate using table 6.
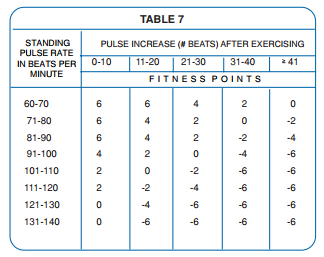
3. Determine the difference between normal standing pulse rate and pulse rate for 0-15 second after stopping exercise. Record this value.
4. Assign a score based on this difference using table 7.
4. Assign a score based on this difference using table 7.
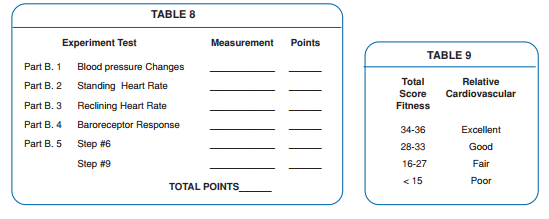
Finding Fitness Score:
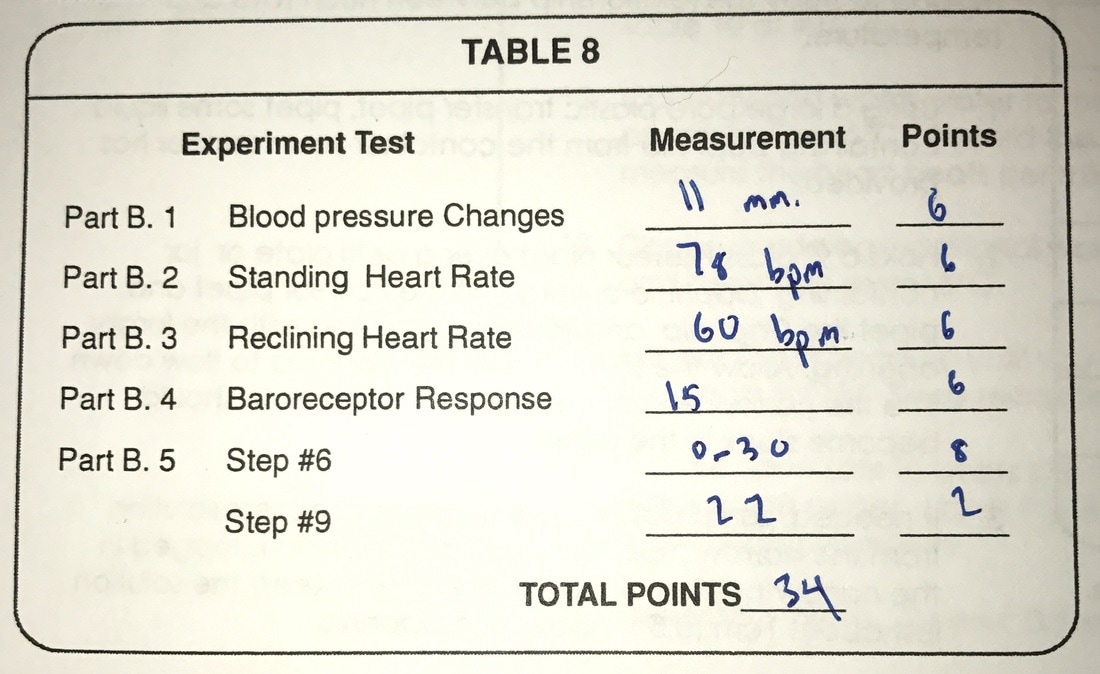
1. Add up all of the points found from previous directions in order to find fitness score. Use table 8 and table 9 to find this value.
1. Add up all of the points found from previous directions in order to find fitness score. Use table 8 and table 9 to find this value.
Data Tables:
Part A:
Part A:
Part B:
Conclusion for Parts A and B:
The hypothesis made for this lab was proven by the results from the lab. The data shows that changes in posture as well as any form of exercise would change and affect the individual's pulse rate and blood pressure. For example the reclining heart rate was 60 bpm, but upon standing up it increased to 78 bpm. Using these changes in heart rate and blood pressure, the fitness score of the individual was also found which is 34 meaning that the individual has an excellent relative cardiovascular. Areas this experiment could have gone wrong would include if the shpygomomanometer wasn't functioning correctly or if the individual being tested was unable to show up the next day.
The hypothesis made for this lab was proven by the results from the lab. The data shows that changes in posture as well as any form of exercise would change and affect the individual's pulse rate and blood pressure. For example the reclining heart rate was 60 bpm, but upon standing up it increased to 78 bpm. Using these changes in heart rate and blood pressure, the fitness score of the individual was also found which is 34 meaning that the individual has an excellent relative cardiovascular. Areas this experiment could have gone wrong would include if the shpygomomanometer wasn't functioning correctly or if the individual being tested was unable to show up the next day.
Part C: Daphnia Magna Temps (lol.. cuz it could be temp as in temeprature, or temp as in like an intern)

Hypothesis: If the temperature of the water the daphnia magna were contained in were to change, then the heart rate of the cold blooded daphnia would change.
Materials:
-1-2 Daphnia magna
-9" pipet
-warm water
-ice
-petri plate
-thermometer
-dissecting microscope
-timer
Procedures:
1. Isolate the Daphnia magna on the petri dish by putting a small droplet of water on the petri dish in order to trap it
2. Observe the specimen under microscope and count the heart beats for 10 seconds and multiply by 6 to find the bpm.
3. Next using ice, cool water down to 5 degrees celsius and put a drop of that water on a petri dish and put the daphnia in it
4. Observe under a microscope and measure bpm. Record the data
5. Add warm water until temperature rises by 5 degrees celsius. Every 5 degree increase in temperature measure bpm and record. Keep recording data until you stop (or until you are unable to monitor the heartbeat accurately)
6. Record Data on graph
7. Find Q10 of data
Data Tables:
Graph:
Graph Justification:
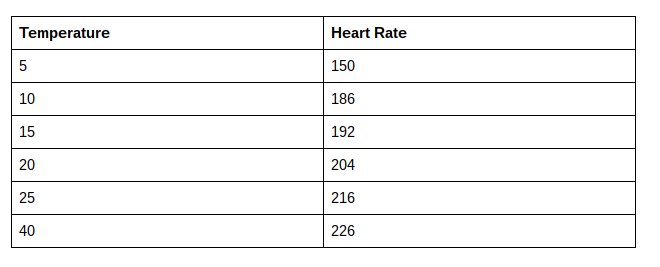
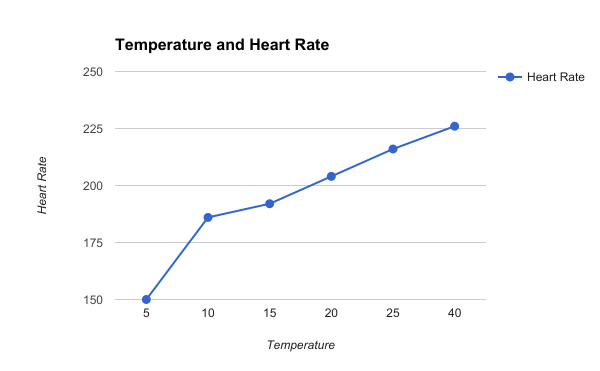
A line graph was chosen in order to represent the increase in heart rate and portray how temperature affects heart rate. The graph shows that as temperature increases, heart rate increases along with it. And there seems to be a major increase from 5 degrees to 10 degrees, while after that the data seems to increase at a steady rate. The independent variable is the temperature and the dependent variable is the heart rate. The hypothesis being tested is how temperature affects the heart rate of the daphnia.
A line graph was chosen in order to represent the increase in heart rate and portray how temperature affects heart rate. The graph shows that as temperature increases, heart rate increases along with it. And there seems to be a major increase from 5 degrees to 10 degrees, while after that the data seems to increase at a steady rate. The independent variable is the temperature and the dependent variable is the heart rate. The hypothesis being tested is how temperature affects the heart rate of the daphnia.
1. Blood pressure varies among different individuals because some people are bigger or healthier than others. This means that their organs (like the heart) are also healthier and work more efficiently making blood and oxygen consumption easier and faster.
2. A poor score on the Fitness Test means that one could be susceptible to many cardiovascular problems and they also may have a high blood pressure and an unhealthy body. This could lead to them needing to seek medical attention.
3. Standing, resting, and exercising heart rates are different because the body goes through different conditions in each one. In resting the body has a lower blood pressure since the body doesn't have to support many different actions or physical pressure. Standing is different since the legs need oxygen for the leg muscles to support the body, but this isn't too strenuous. Exercising makes the body move and the muscles stretch and contract which uses energy and oxygen making the blood have to move more and faster.
4. Athletes are capable of delivering more oxygenated blood to their bodies since their bodies are conditioned to the constant pressure that comes with their work. They have to constantly work out and exercise in order to stay in shape and thus trains the body to maximize oxygen consumption.
5. An athlete has to work harder to achieve a maximum heart rate because the muscles are more efficient in the oxygen consumption and is able to maximize the amount of oxygen it gets from the blood. This means that less blood is needed to get the muscles working. So more work is needed in order to get the muscles to have to consume more oxygen and thus increase blood circulation.
6. The Daphnia's heart slows at lower temperatures because they aren't warm blooded creatures meaning they can't produce their own heat. So when the external temperature is cool, it cools down their body and forces them to slow down.
7. The heart rate of an endothermic organism is usually unaffected by changes in the environment because they can produce their own heat and do not rely on the environment for their body temperature.
8. An ectothermic organism regulate their temperature by changing their external environment in order to satisfy their needs. For example, lizards tend to sun themselves in order to warm up their body, but if it gets too hot they'd stay under the shade or cool off in water. This is why most pet owners who own lizards need their habitats to have a strong lamp.
Conclusion:
The hypothesis made was proven by the results of this lab. The results showed that as the temperature changed, the Daphnia's heart rate also changed along with it and even more so the data is in accordance with common traits of cold blooded creatures. At low temperatures the creatures had a slower metabolic rate thus resulting in a slower heart rate and less blood needed to pump. Areas this experiment could have gone wrong would be if the daphnia died, if the light from the microscope heated up the water too fast, or if the daphnia wasn't trapped and thus wasn't easy to observe.
