Title: Plants are Thirsty Hoes
Hypothesis: If the plant is exposed to differing environmental conditions affecting the opening and closing of stomates in the leaf, then the rate of transpiration will also be affected, and will be affected differently according to the different environmental conditions.
Materials:
• 10 mL pipets
• Vinyl tubing
• Petroleum jelly
• Water
• Plant mister (a spray bottle)
• Potting soil
• Large plastic bags
• Ring stands & clamps (or buret holder)• Scalpel blade
• Weighing scale
• Ruler
Procedures: (For my lab, I specifically investigated mist)
Investigation I: Transpiration in Phaseolus vulgaris (Bush Bean)
1. Carefully place the non-tapered end of a 0.1 mL pipet into one end of a 16” piece of vinyl tubing. A small amount of petroleum jelly can be placed on the outside of the pipet at the non-tapered end to help insertion of the pipet.
2. Bend the tube into a U shape and secure onto a ring stand with clamp(s) as shown in Figure 1. The top of the tubing and the top of the pipet must be level in order to fi ll completely with water.
3. Fill the tubing and 0.1 mL pipet completely with water from the tubing end, using a 10 mL pipet. No air bubbles should be present in the tubing or 0.1 mL pipet.
4. Insert a freshly cut stem from a 2 week old bush bean seedling into the end of the tubing and seal with petroleum jelly. Do not get petroleum jelly onto the cut end of the stem or the experiment will not work! No bubbles should be present in the tubing or 0.1 mL pipet (Figure 1).
5. Expose the plant to mist and immediately cover with a plastic bag after misting
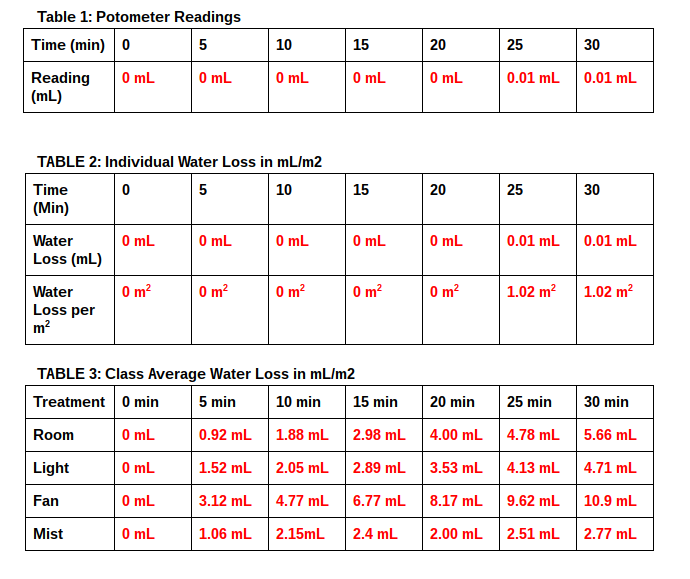
6. After a 10 minute equilibration period, read the water level in the pipet and record below as time 0. You may want to use a marker to draw a line at the water level for each time point.
(Hint: 12 mm = 0.01 mL)
7. Obtain a reading once every 5 minutes for 30 minutes.
8. After 30 minutes, cut off the leaves of the bush bean seedling and blot off any excess water gently. Weigh the leaves. Weight of leaves 0.889 grams.
9. Estimate the total leaf surface area for the plant.
• Cut a 1 cm2 section out of a leaf
• Mass the cut section = 0.009 grams.
• Multiply cut section mass by 10,000 to obtain the mass per square meter of the leaf = 90 g/m2
• Using the formula below obtain the total leaf surface area (m2)):
• Leaf Surface Area (m2) = 0.0098 m2
10. Using the formula below calculate water loss in mL/m2 at each reading (Table 1) by dividing the reading by the calculated leaf surface area:
(water level at each T in mL) - (water level at Time 0 in mL) / total leaf surface area in m2
11. Plot the class average data of water loss (mL/m2d) versus time (minutes). Using liner graph paper, plot water loss on the y-axis vs. time on the x-axis.
Hypothesis: If the plant is exposed to differing environmental conditions affecting the opening and closing of stomates in the leaf, then the rate of transpiration will also be affected, and will be affected differently according to the different environmental conditions.
Materials:
• 10 mL pipets
• Vinyl tubing
• Petroleum jelly
• Water
• Plant mister (a spray bottle)
• Potting soil
• Large plastic bags
• Ring stands & clamps (or buret holder)• Scalpel blade
• Weighing scale
• Ruler
Procedures: (For my lab, I specifically investigated mist)
Investigation I: Transpiration in Phaseolus vulgaris (Bush Bean)
1. Carefully place the non-tapered end of a 0.1 mL pipet into one end of a 16” piece of vinyl tubing. A small amount of petroleum jelly can be placed on the outside of the pipet at the non-tapered end to help insertion of the pipet.
2. Bend the tube into a U shape and secure onto a ring stand with clamp(s) as shown in Figure 1. The top of the tubing and the top of the pipet must be level in order to fi ll completely with water.
3. Fill the tubing and 0.1 mL pipet completely with water from the tubing end, using a 10 mL pipet. No air bubbles should be present in the tubing or 0.1 mL pipet.
4. Insert a freshly cut stem from a 2 week old bush bean seedling into the end of the tubing and seal with petroleum jelly. Do not get petroleum jelly onto the cut end of the stem or the experiment will not work! No bubbles should be present in the tubing or 0.1 mL pipet (Figure 1).
5. Expose the plant to mist and immediately cover with a plastic bag after misting
6. After a 10 minute equilibration period, read the water level in the pipet and record below as time 0. You may want to use a marker to draw a line at the water level for each time point.
(Hint: 12 mm = 0.01 mL)
7. Obtain a reading once every 5 minutes for 30 minutes.
8. After 30 minutes, cut off the leaves of the bush bean seedling and blot off any excess water gently. Weigh the leaves. Weight of leaves 0.889 grams.
9. Estimate the total leaf surface area for the plant.
• Cut a 1 cm2 section out of a leaf
• Mass the cut section = 0.009 grams.
• Multiply cut section mass by 10,000 to obtain the mass per square meter of the leaf = 90 g/m2
• Using the formula below obtain the total leaf surface area (m2)):
• Leaf Surface Area (m2) = 0.0098 m2
10. Using the formula below calculate water loss in mL/m2 at each reading (Table 1) by dividing the reading by the calculated leaf surface area:
(water level at each T in mL) - (water level at Time 0 in mL) / total leaf surface area in m2
11. Plot the class average data of water loss (mL/m2d) versus time (minutes). Using liner graph paper, plot water loss on the y-axis vs. time on the x-axis.
Graph:
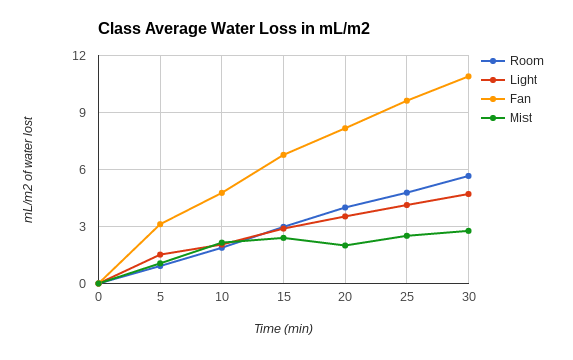
Graph Justifications: This type of graph was chosen in order to make data comparison between the 4 different variables easier and more visual. This type of graph better illustrates the increasing and decreasing of water loss. In the graph the independent variable is the conditions the plants were subjected to (ie: room temperature, light, mist, fan) and in this graph another independent variable that is actually shown is time in minutes, and the dependent variable is the water loss. The graph is able to show how each variable affects the water loss and shows that my hypothesis is correct in how the different variable changes also resulted in a change in the rate of transpiration and water loss.
Conclusion: The hypothesis was supported by the experiment. The data showed that the different variables that the different environmental were affecting the opening and closing of stomates in the leaves with some variables causing the rate of water loss to increase along with the rate of transpiration. Some sources of error would include the amount of water sprayed, how often the plant was misted, or if the plant stem was broken or not. When replicating this experiment, regulate the amount of times misted and the times that you do mist, as well as try not to break the plant with the bag that is to be put over the plant.
Conclusion: The hypothesis was supported by the experiment. The data showed that the different variables that the different environmental were affecting the opening and closing of stomates in the leaves with some variables causing the rate of water loss to increase along with the rate of transpiration. Some sources of error would include the amount of water sprayed, how often the plant was misted, or if the plant stem was broken or not. When replicating this experiment, regulate the amount of times misted and the times that you do mist, as well as try not to break the plant with the bag that is to be put over the plant.
Investigation 2:
Title: The Stem of Our Problems (HAH, get it? no? okay...)
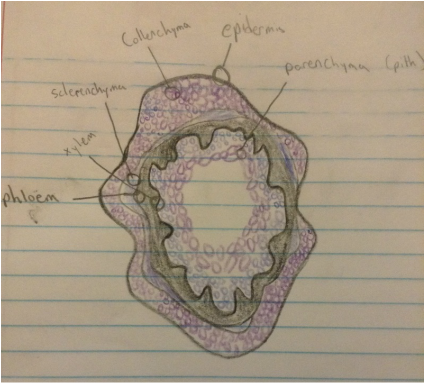
Hypothesis: If a microtome was created in order to view the plant cells in the stem, then one will see the xylem, phloem, epidermis, parenchyma, sclerenchyma and collenchyma.
Materials:
Procedures: (For my lab, I specifically investigated mist)
2. Cut a fresh slice of bush bean stem about 5-6 mm in length. It should be slightly longer than the cup you have formed in the microtome.
3. Place the cut stem into the microtome so that it stands up. Using a Pasteur pipet, fill the cup with melted parawax provided by your instructor. Work quickly as the para-
wax will cool and solidify in the pipet.
4. Wait 5-10 minutes for the parawax to completely solidify. When the wax has solidi-fi ed, lay the microtome on its side and with a new single-edged razor or scalpel blade, carefully slice away the excess wax (Figure 2).
5. Twist the bolt slightly to expose a thin piece of wax. Carefully slice off a thin section of wax/stem. With this simple apparatus, you are preparing thin cross sections of the bush bean stem. Using a spatula, place the sections in the petri plate containing 50% ethanol. Prepare 10 -12 sections. Allow the sections to soak for 5 minutes.
6. Transfer the sections to the Toluidine blue O stain solution contained in another petri plate. Stain for 5-10 minutes.
7. Transfer the stained sections to the petri plate containing distilled water.
8. Place the sections onto a microscope slide and add a drop of mounting medium or 50% glycerol, and cover with a coverslip.
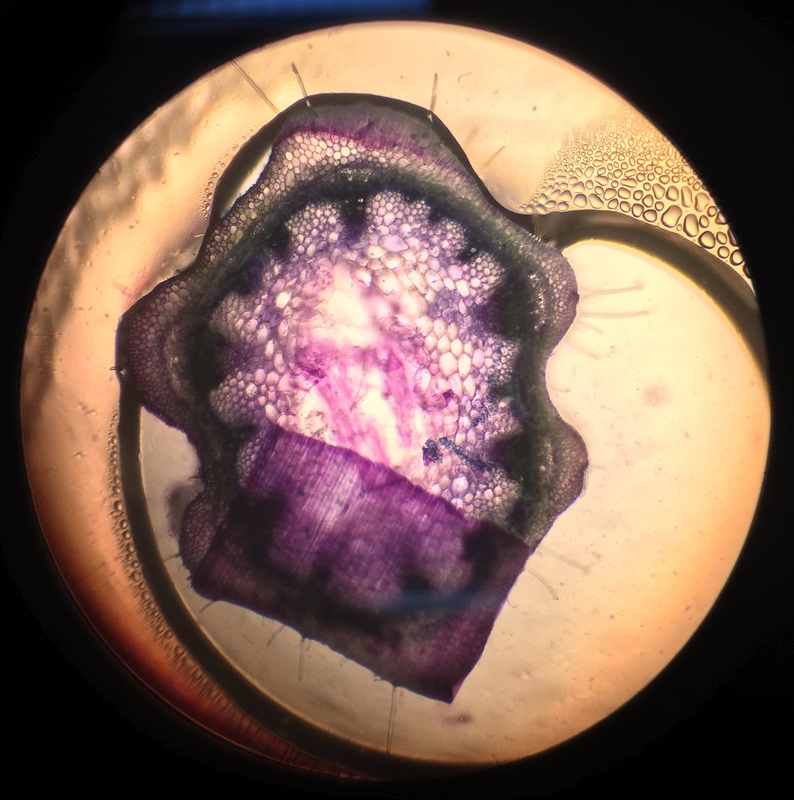
9. Observe the sections under a compound light microscope.
10. Make drawings of the structures you observe.
Title: The Stem of Our Problems (HAH, get it? no? okay...)
Hypothesis: If a microtome was created in order to view the plant cells in the stem, then one will see the xylem, phloem, epidermis, parenchyma, sclerenchyma and collenchyma.
Materials:
- Microscope slides
- Microscope(s)
- Cover slips
- Slide mounting medium, i.e. 50% glycerol
- 50% ethanol
- New razor or scalpel blades
- Small spatulas
- Bolt
- Nut
- Wax
- Toluidine Blue O stain
- Distilled water
Procedures: (For my lab, I specifically investigated mist)
- Obtain and assemble the nut and bolt microtome. Adjust the bolt so that there is a small cup at the end.
2. Cut a fresh slice of bush bean stem about 5-6 mm in length. It should be slightly longer than the cup you have formed in the microtome.
3. Place the cut stem into the microtome so that it stands up. Using a Pasteur pipet, fill the cup with melted parawax provided by your instructor. Work quickly as the para-
wax will cool and solidify in the pipet.
4. Wait 5-10 minutes for the parawax to completely solidify. When the wax has solidi-fi ed, lay the microtome on its side and with a new single-edged razor or scalpel blade, carefully slice away the excess wax (Figure 2).
5. Twist the bolt slightly to expose a thin piece of wax. Carefully slice off a thin section of wax/stem. With this simple apparatus, you are preparing thin cross sections of the bush bean stem. Using a spatula, place the sections in the petri plate containing 50% ethanol. Prepare 10 -12 sections. Allow the sections to soak for 5 minutes.
6. Transfer the sections to the Toluidine blue O stain solution contained in another petri plate. Stain for 5-10 minutes.
7. Transfer the stained sections to the petri plate containing distilled water.
8. Place the sections onto a microscope slide and add a drop of mounting medium or 50% glycerol, and cover with a coverslip.
9. Observe the sections under a compound light microscope.
10. Make drawings of the structures you observe.
Analysis Question
2. Determine the average amount of water loss per milliliter per square meter for each
treatment:
a. Room: 0.79 mL/m2 lost per minute
b. Light: 0.53 mL/m2 lost per minute
c. Fan: 1.29 mL/m2 lost per minute
d. Mist: 0.28 mL/m2 lost per minute
3. Explain how each condition affects water loss.
Room Temperature: There was no change in water lost since there is no factor that would have resulted in more or less water loss.
Light: With light there should have been more change and water loss should have increased since the heat from the light should have evaporated water faster causing the rate of transpiration to increase. This factor should have the highest rate of transpiration and a higher water loss rate than the other factors.
Fan: There should have been a major increase in water loss since the air currents is able to evaporate the water and thus causes the rate of transpiration to increase.
Mist: The rate of transpiration should have little change or even decreased since the water from the mist is resulting in less water being lost in transpiration. The water loss for this factor should have a lower rate than with the other factors.
4. How did these conditions affect the stem to leaf water gradient?
These conditions affected the stem to leaf water gradient by either causing the leaf to lose more water due to outside changes that result in water being evaporated faster, or the leaf to not lose as much water because the conditions the leaves were in were so that the air had a lot of water and resulted in less water being evaporated.
5. What is the importance of water potential in controlling the transport of water?
Since water moves from places of high concentration to low, water potential is what causes the water to move up the roots and stem into the leaves since the water leaves the leaves since the air has a lower concentration than the air. In turn, the leaves then have a lower concentration of water resulting in the leaves pulling water from the stem.
6. Explain several mechanisms by which plants try to minimize water loss.
Some mechanisms where plants would try to minimize water loss would include closing the stomata during the day and only opening at night so that there is less water loss in the cool environment of night. As well as some plants having thicker cuticles thus preventing water from exiting, or hairs on the leaves to break air currents resulting in a decrease in water loss.
- What is the total leaf surface area for the plant?
2. Determine the average amount of water loss per milliliter per square meter for each
treatment:
a. Room: 0.79 mL/m2 lost per minute
b. Light: 0.53 mL/m2 lost per minute
c. Fan: 1.29 mL/m2 lost per minute
d. Mist: 0.28 mL/m2 lost per minute
3. Explain how each condition affects water loss.
Room Temperature: There was no change in water lost since there is no factor that would have resulted in more or less water loss.
Light: With light there should have been more change and water loss should have increased since the heat from the light should have evaporated water faster causing the rate of transpiration to increase. This factor should have the highest rate of transpiration and a higher water loss rate than the other factors.
Fan: There should have been a major increase in water loss since the air currents is able to evaporate the water and thus causes the rate of transpiration to increase.
Mist: The rate of transpiration should have little change or even decreased since the water from the mist is resulting in less water being lost in transpiration. The water loss for this factor should have a lower rate than with the other factors.
4. How did these conditions affect the stem to leaf water gradient?
These conditions affected the stem to leaf water gradient by either causing the leaf to lose more water due to outside changes that result in water being evaporated faster, or the leaf to not lose as much water because the conditions the leaves were in were so that the air had a lot of water and resulted in less water being evaporated.
5. What is the importance of water potential in controlling the transport of water?
Since water moves from places of high concentration to low, water potential is what causes the water to move up the roots and stem into the leaves since the water leaves the leaves since the air has a lower concentration than the air. In turn, the leaves then have a lower concentration of water resulting in the leaves pulling water from the stem.
6. Explain several mechanisms by which plants try to minimize water loss.
Some mechanisms where plants would try to minimize water loss would include closing the stomata during the day and only opening at night so that there is less water loss in the cool environment of night. As well as some plants having thicker cuticles thus preventing water from exiting, or hairs on the leaves to break air currents resulting in a decrease in water loss.

I had to google, "transpiration memes" just to find this...
I hope you're satisfied
I hope you're satisfied
