Investigation 1: Estimation of gene frequency for the Trait to Taste PTC within a small sample population.
Hypothesis: If one surveys his/her class in order to find out the allele frequency for the PTC tasting genes within their class population, then their results will match the allele frequencies of the North American population.
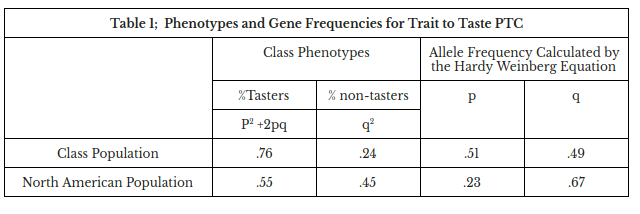
This experiment deals with the determination of the gene frequency of a human trait amongst students with no known selective advantage. The ability to taste the chemical phenylthiocarbamide, PTC, is one such human trait. The ability to taste PTC is due to the presence of a dominant allele, T. Therefore, all tasters will either be homozygous, TT, or heterozygous, Tt. Non-tasters will be homozygous for the recessive gene, tt.
Materials: PTC taste strip, normal strip of paper, pencil, paper, calculator
Procedures:
- Students groups should obtain a PTC taste strip and a control strip.
- Every member of the group should first taste the control strip of paper.
- Every person should taste the PTC impregnated strip of paper. Compare the taste of the control and the PTC paper. If you are a taster, the PTC paper strip will be bitter. Non-tasters will not notice a difference between either strip of paper.
- For the class, record the total number of tasters and the total number of non-tasters on the blackboard. Also record the results in your lab notebook.
- Determine decimal value by division for tasters (p2 + 2pq), and likewise the decimal value for non-tasters (q2).
- For example, there are 100 people in your class. 25 are non-tasters and 75 are tasters.
- Then 25/100, or 0.25, is the frequency of non-tasters, and 75/100, or 0.75, is the frequency of tasters.
- Record your values in Table 1. Use Hardy-Weinberg as described above to determine the value of p and q for your class.
Conclusion: Within this experiment, it seemed that the allele frequency of this AP Bio class seemed to deviate quite a bit from the North American Population survey. The frequency of the dominant allele was higher within the class population when compared to the NA population. And the recessive allele frequency was lower than the NA population. These results did not prove my hypothesis since it seems that the frequencies of both alleles are too different to be considered similar. Some sources of error within this experiment would include the selection of people, but the biggest one of all since it violates the prerequisites for Hardy-Weinberg is that the population size is too small.
Study Questions:
- What is the frequency of homozygous tasters , P2, in your classroom?
- What is the frequency of heterozygous tasters, 2pq, in your classroom?
- What is the frequency of homozygous non-tasters, q2, in your classroom?
- Determine the percentage of the three genotypes TT, Tt, and tt in your classroom.
Investigation II: Building a simple Mathematical Spreadsheet
Hypothesis: If one creates a graph of this mathematical spreadsheet for each time they change the allele frequency, then the graph will match according to the allele frequencies that was set.
Materials: spreadsheet, computer
Procedures:
Make a copy of this spreadsheet
- Using the data in the spreadsheet. Make a histogram.
- Label the independent variable (horizontal x-axis)
- Label the dependent variable (vertical y-axis)
- Title the Graph
- Change the allele frequency from A= 0.5 and B= 0.5 to A= .75 and B= .25
- Make a graph of this
- Change the allele frequency again from A= .75 and B= .25 to A= .25 and B=.75
- Make a graph of this new data
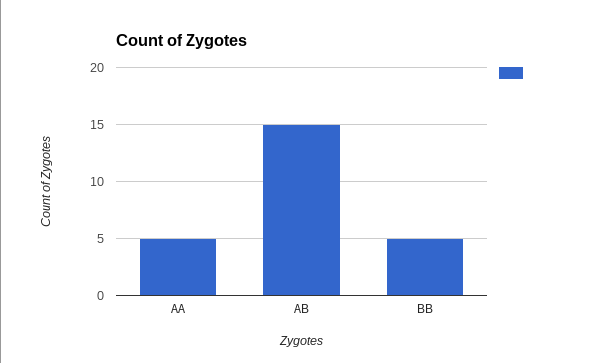
Graph Justification: A bar graph was chosen in order to make the comparison of the zygote counts easier. Here we can see that with the A allele and the B allele frequencies being equal to each other, the graph shows the AA and BB counts being the same.
Graph 2: Allele Frequency- A= .75; B= .25
Graph 2: Allele Frequency- A= .75; B= .25
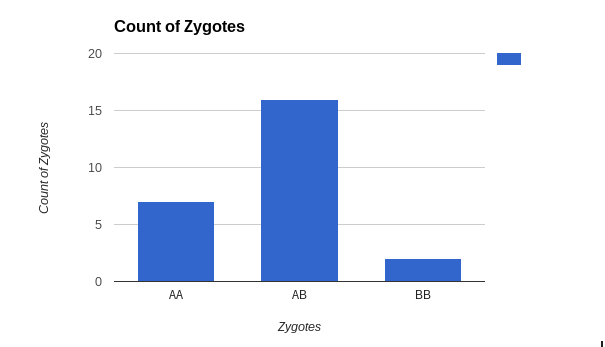
Graph Justification: A bar graph was chosen in order to make the comparison of the zygote counts easier. The graph shows that if one was to increase the A allele frequency, then the AA gene becomes more frequent and is higher than BB.
Graph 3: Allele Frequency- A= .25; B= .75
Graph 3: Allele Frequency- A= .25; B= .75
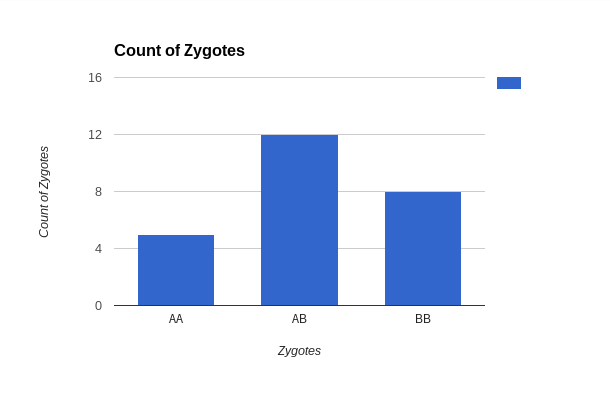
Graph Justification: A bar graph was chosen in order to make the comparison of the zygote counts easier. This graph also shows that if one changes the allele frequencies and put them in favor of the B allele, then the BB gene (as shown in the graph) would increase and be more than the AA gene.
Investigation III: Testing your mathematical model to explore the behavior of allele frequencies from generation to generation.
Hypothesis: If a population was subject to a bottleneck effect, then the allele frequencies of the newer generations would still be similar to the parents and will continue to do so as the population grows again.
Materials: laptop/computer, spreadsheet
Procedures:
1. Duplicate rows until you have 250 individuals in your population
2. Calculate zygote genotypes and the values for each genotype
3. Calculate allele counts for A and B alleles
4. Make graph on data of zygote genotypes
5. Make graph on allele counts
6. Make a copy (new generation)
7. Decrease population from 250 to 50 on new generation
8. Repeat steps 2-5
9. With each new generation, increase the population by 50
10. For each generation, repeat steps 2-5
11. Keep making new generations until the population reaches 250 again
Parent Generation:
Investigation III: Testing your mathematical model to explore the behavior of allele frequencies from generation to generation.
Hypothesis: If a population was subject to a bottleneck effect, then the allele frequencies of the newer generations would still be similar to the parents and will continue to do so as the population grows again.
Materials: laptop/computer, spreadsheet
Procedures:
1. Duplicate rows until you have 250 individuals in your population
2. Calculate zygote genotypes and the values for each genotype
3. Calculate allele counts for A and B alleles
4. Make graph on data of zygote genotypes
5. Make graph on allele counts
6. Make a copy (new generation)
7. Decrease population from 250 to 50 on new generation
8. Repeat steps 2-5
9. With each new generation, increase the population by 50
10. For each generation, repeat steps 2-5
11. Keep making new generations until the population reaches 250 again
- Effects the size of the population on the gene frequencies in the next generation. To observe the effects of a population sizes on gene frequency, insert or delete new rows into your spreadsheet. Try recalculating every time to make sure the spreadsheet is working as expected by pressing the “F9” or Cmd + key. You should notice the changes in the worksheet every time you recalculate.
Parent Generation:
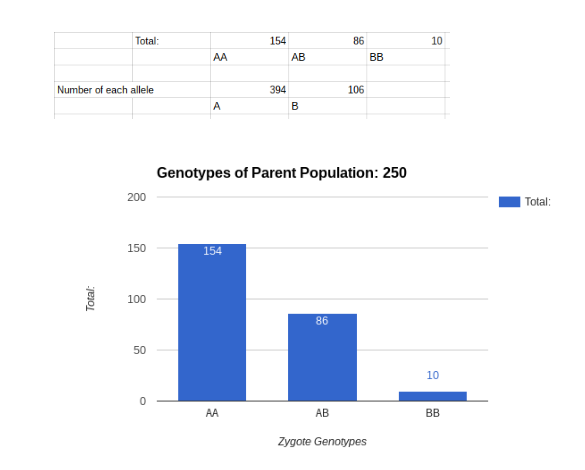
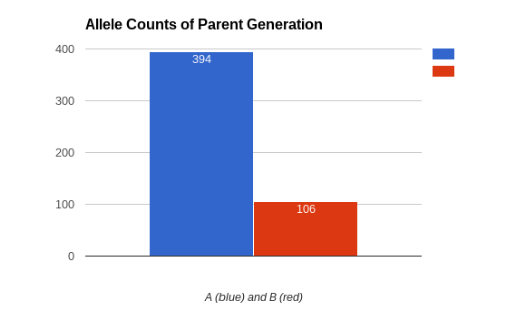
Graph Justification: This kind of graph was chosen to represent this data, as well as the rest of the data within this investigation, because it made it easier to compare data within the graph, as well as comparing separate graphs. This graph represents the zygotes of the parent generation as well as the allele counts of the parent generation. We will be comparing all future graphs to this graph.
F1:
F1:
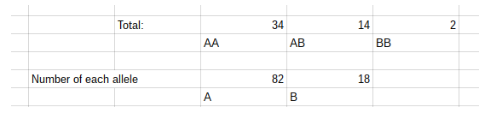
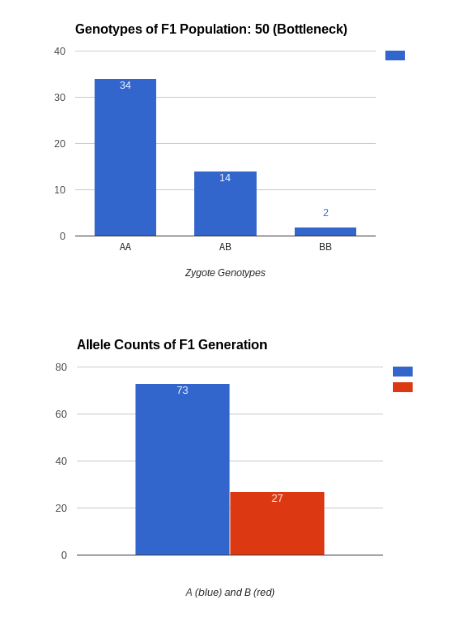
Graph Justification: When we compare this to the parent graph, we see that following the population decrease, there seems to be more AA genotypes, but when comparing the allele counts, the counts for B is relatively higher. A bar graph is used in order to make data comparison easier.
F2:
F2:
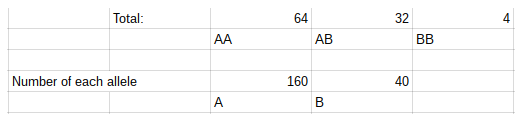
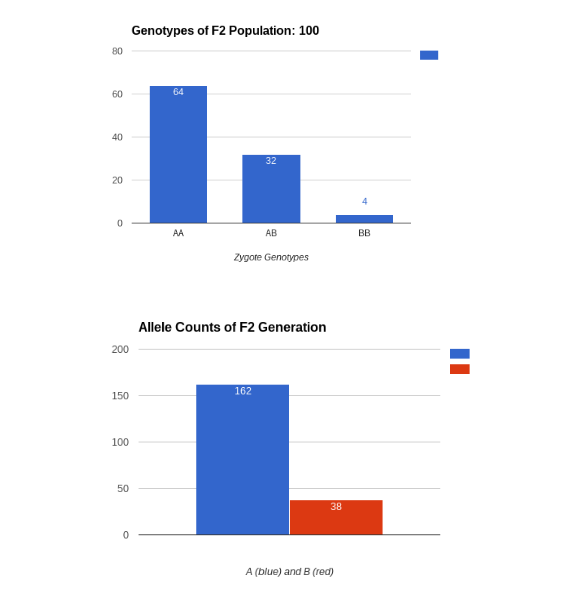
Graph Justification: With the second generation, the genotype graphs look almost identical with the parent graphs. As for the allele counts, it seems that there is still a decrease in the B allele. A bar graph is used in order to make data comparison easier.
F3:
F3:
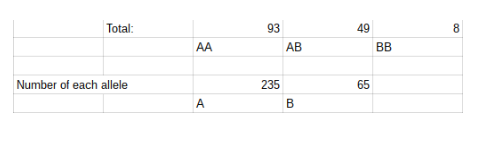
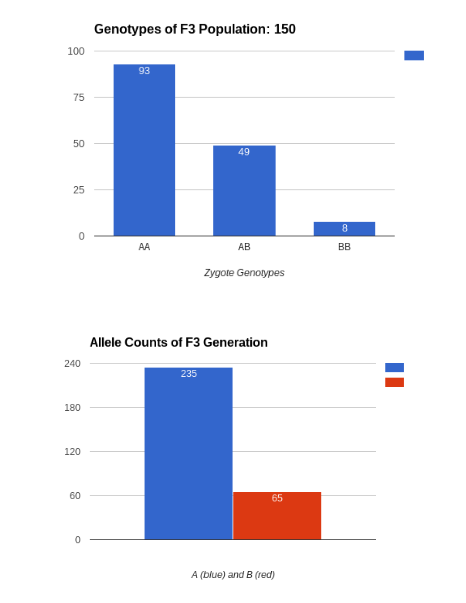
Graph Justification: We see that as the population increases the similarities between the next generations and the parental graphs. This graph is almost identical to the parent graphs. A bar graph is used in order to make data comparison easier.
F4:
F4:
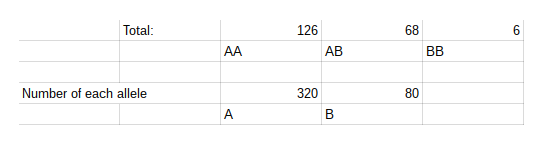
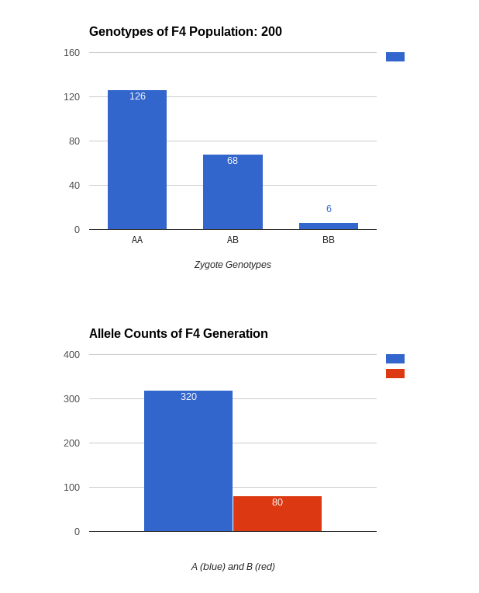
Graph Justification: The zygote genotypes graph is almost identical with the parent graph, as well as the allele counts. A bar graph is used in order to make data comparison easier.
F5:
F5:
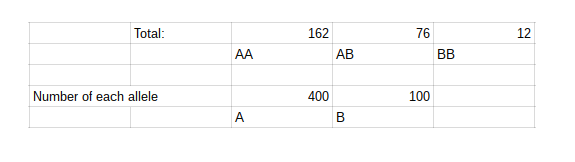
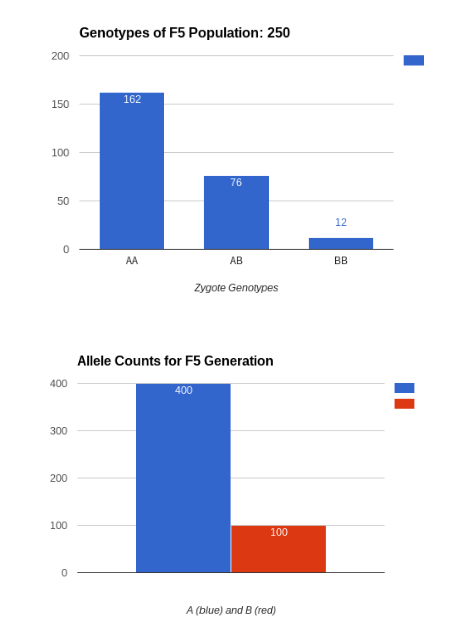
Graph Justification: If we compare the graph shape as well as the exact counts for the zygote genotypes and the allele counts, we see that the new generation of 250 zygotes are almost exactly the same as the parents before the bottleneck event. A bar graph is used in order to make data comparison easier.
Conclusion: The data with each generation and each growing population was similar or the same as the parent graph and only had some minor changes to it. This proves my hypothesis to be correct since the graphs didn’t really change, and the allele frequencies for each generation was very similar to the parent allele frequencies. As well as the allele counts being similar when comparing it to the parents graph. When redoing the experiment you can try using a larger population and more generations to get more accurate results As well as changing the allele frequency at the start in order to see how the population shifts and changes.
Study Questions: These questions can be investigated with your spreadsheets and the data used to support your answers. If you do not use these in investigation 2 then research the answers and find specific evidence (3 per question) to support your claim. All answers will require a citation.
Sources:
"Lethal Inheritance Patterns - Boundless Open Textbook."Boundless. Web. 22 Sept. 2016.
Shmoop Editorial Team. "Lethal Alleles - Shmoop Biology."Shmoop.com. Shmoop University, Inc., 11 Nov. 2008. Web. 22 Sept. 2016.
"The "bad" Gene." The "bad" Gene. Web. 22 Sept. 2016.
2. Polydactyly, more than 5 digits per hand, is a dominant trait. Why is polydactyly not a common trait in human populations?
There is a common misconception in genetics, the belief that since it is a dominant gene, it is the most common, but this isn’t true. Genetics rely on the population as well as the gene and allele frequency. But if the population has more recessive than dominant, although the dominant is shown, the dominant to recessive ratio stays the same. An example is shown from KQUED on the topic of dominant not always being common, in this article they give us an example, "Nearly everyone in most of Africa has brown eyes. This isn’t because brown eyes are dominant over blue and green. Instead, it is because there are mostly brown alleles of OCA2 in the African population. Northern Europe is a different story. In some parts of the continent, over 80% of the population has lighter colored eyes. Here the not-brown allele is more common even though it is recessive (Dominant Isn't Always Common)." This is the same as polydactyly, the dominant gene of polydactyly just isn’t common enough for it to become a trait shared by a large portion of the population.
University, By Alisa Lehman Stanford. "Understanding Genetics." Understanding Genetics. Web. 18 Sept. 2016.
@geneticsboy. "Dominant Isn’t Always Common." QUEST. Web. 22 Sept. 2016.
3. How does the inheritance of traits or allele frequencies change in a population? How can this be beneficial or harmful to the organisms?
The inheritance of traits or allele frequencies change in a population due to different effects that change populations as well as environmental factors that can favor one gene or another. Some natural effects such as genetic drift and the bottleneck effect. Which could cause the population to change, as well as affect the allele frequencies. Other forms of selection would be natural selection, where the genes of one kind of an organism helps it survive better than another organism with slightly different genes. For example, an article on evolution by National Geographic, they talk about the peppered moth, and they state, "Coal smoke had darkened England’s trees, so that light pepper moths, once blended nicely against bark, now stood out against the smudgy background. A dark form of peppered moths, once rare, became common. (Evolution in Color)" This change in the environment led to the dark peppered moth surviving longer thus allowing them to reproduce and spread their genes more. Then later on as pollution cleared, the white peppered moths seemed to flourish, while the black ones become rare again.
"Mechanisms of Change."Mechanisms of Change. Web. 23 Sept. 2016
By the End of This Tutorial You Should Have a Basic Understanding Of:. "Contents." Genetic Change in Populations. Web. 23 Sept. 2016
Conclusion: The data with each generation and each growing population was similar or the same as the parent graph and only had some minor changes to it. This proves my hypothesis to be correct since the graphs didn’t really change, and the allele frequencies for each generation was very similar to the parent allele frequencies. As well as the allele counts being similar when comparing it to the parents graph. When redoing the experiment you can try using a larger population and more generations to get more accurate results As well as changing the allele frequency at the start in order to see how the population shifts and changes.
Study Questions: These questions can be investigated with your spreadsheets and the data used to support your answers. If you do not use these in investigation 2 then research the answers and find specific evidence (3 per question) to support your claim. All answers will require a citation.
- Why do recessive lethal alleles like cystic fibrosis stay in the human population? Why don’t they gradually disappear?
Sources:
"Lethal Inheritance Patterns - Boundless Open Textbook."Boundless. Web. 22 Sept. 2016.
Shmoop Editorial Team. "Lethal Alleles - Shmoop Biology."Shmoop.com. Shmoop University, Inc., 11 Nov. 2008. Web. 22 Sept. 2016.
"The "bad" Gene." The "bad" Gene. Web. 22 Sept. 2016.
2. Polydactyly, more than 5 digits per hand, is a dominant trait. Why is polydactyly not a common trait in human populations?
There is a common misconception in genetics, the belief that since it is a dominant gene, it is the most common, but this isn’t true. Genetics rely on the population as well as the gene and allele frequency. But if the population has more recessive than dominant, although the dominant is shown, the dominant to recessive ratio stays the same. An example is shown from KQUED on the topic of dominant not always being common, in this article they give us an example, "Nearly everyone in most of Africa has brown eyes. This isn’t because brown eyes are dominant over blue and green. Instead, it is because there are mostly brown alleles of OCA2 in the African population. Northern Europe is a different story. In some parts of the continent, over 80% of the population has lighter colored eyes. Here the not-brown allele is more common even though it is recessive (Dominant Isn't Always Common)." This is the same as polydactyly, the dominant gene of polydactyly just isn’t common enough for it to become a trait shared by a large portion of the population.
University, By Alisa Lehman Stanford. "Understanding Genetics." Understanding Genetics. Web. 18 Sept. 2016.
@geneticsboy. "Dominant Isn’t Always Common." QUEST. Web. 22 Sept. 2016.
3. How does the inheritance of traits or allele frequencies change in a population? How can this be beneficial or harmful to the organisms?
The inheritance of traits or allele frequencies change in a population due to different effects that change populations as well as environmental factors that can favor one gene or another. Some natural effects such as genetic drift and the bottleneck effect. Which could cause the population to change, as well as affect the allele frequencies. Other forms of selection would be natural selection, where the genes of one kind of an organism helps it survive better than another organism with slightly different genes. For example, an article on evolution by National Geographic, they talk about the peppered moth, and they state, "Coal smoke had darkened England’s trees, so that light pepper moths, once blended nicely against bark, now stood out against the smudgy background. A dark form of peppered moths, once rare, became common. (Evolution in Color)" This change in the environment led to the dark peppered moth surviving longer thus allowing them to reproduce and spread their genes more. Then later on as pollution cleared, the white peppered moths seemed to flourish, while the black ones become rare again.
"Mechanisms of Change."Mechanisms of Change. Web. 23 Sept. 2016
By the End of This Tutorial You Should Have a Basic Understanding Of:. "Contents." Genetic Change in Populations. Web. 23 Sept. 2016
